

Power BI beginner for Not-for-profits 24 June
This hands-on, instructor-led course is designed to empower not-for-profit professionals with the fundamental skills needed to use Power BI...
Learn more
Microsoft Excel Kevin Stratvert Training Playlist
Explore 80 + videos within this valuable Microsoft Excel playlist by Kevin Stratvert, designed for anyone wishing to improve their Excel skills, from...
Learn more
Data storytelling principles: Narrative beyond numbers
Data storytelling is the art of building a compelling narrative based on data and analytics that will help transform it into an understandable...
Learn more
Theory of change to articulate your outcomes and impact
After a successful webinar in 2023, Pablo returns to teach NFPs how to articulate the issues they're addressing through storytelling. Break down the...
Access recording
Project management fundamentals
In this returning webinar, Pablo will guide you through project management theory and practice. By examining a real-life case study from the...
Access recording
Six data collection essentials with Google Sheets & Forms
Following the success of this webinar from the 2023 program, Pablo will return again to help you acquire vital data collection skills that will...
Access recording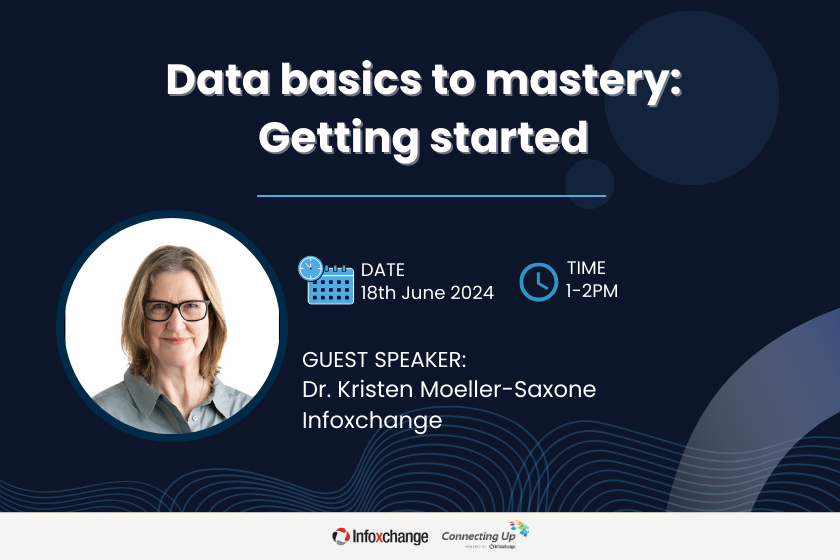
Data basics to mastery: Getting started
Want to Master Your Data? Start Here! Join Us for a Beginner’s Data Journey and Access the Most Critical Tools to Improve Your Data...
Access recording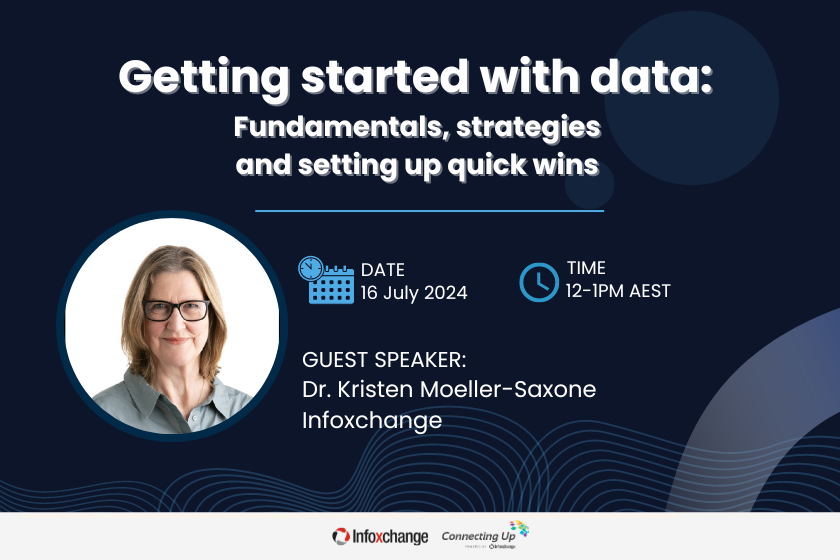
Getting started with data: Fundamentals, strategies and setting up quick wins
Not-for-profits who are starting their data journey can find it hard to know where to begin. This webinar takes you through the fundamentals of...
Access recording
Getting Started with Analytics: Tools, Infrastructure & Data
We're all familiar with the importance of data, but how do NGOs with limited resources get started? This session will provide practical tips on the...
Access recording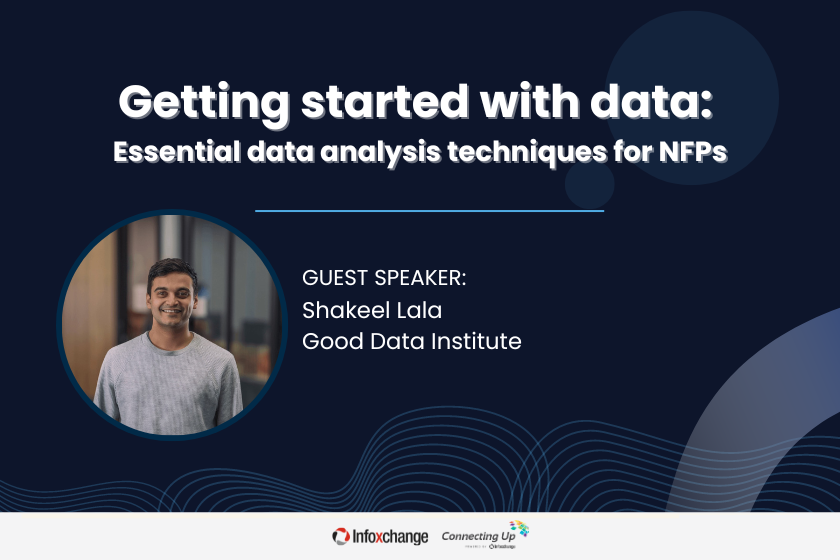
Getting started with data: Essential data analysis techniques for NFPs
Every not-for-profit (NFP) faces challenges that require solutions, needs to persuade donors or funders, and must produce impactful reports....
Access recording
Data & analytics: Foundations and what's coming up
Join us for an insightful webinar on Data & analytics: Foundations & what’s coming up. This session is designed to help you...
Access recording
Getting started with data: Microsoft Power BI for data analysis
Join Chris and Benny for this webinar as they walk you through Microsoft Power BI for data analysis. Participants will learn to enhance their data...
Access recording
Getting started with data: Hands-on with Microsoft Power BI for data visualisation
Join Chris and Benny for an interactive, hands-on session where you’ll learn how to use Microsoft Power BI to transform your data into compelling...
Access recording
Scoping an AI project? Do it with data
Have you been tasked with scoping an AI project for your organisation? In this session, you’ll learn how to clearly define your...
Access recording